Musings: Is the Rig Count About to Rebound? Scenarios for The Future


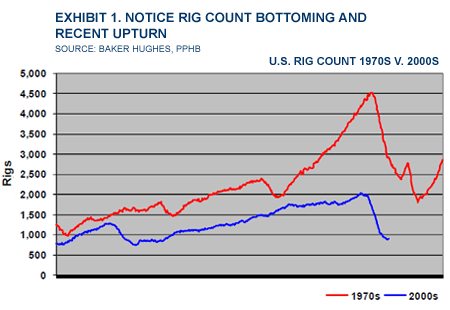
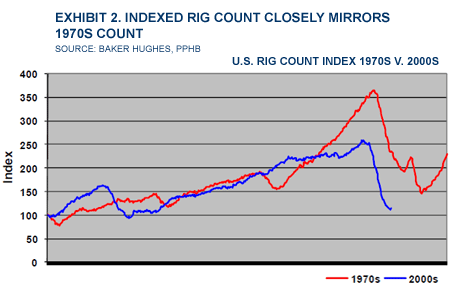
Last week Baker Hughes reported that their rig count for active rigs in the United States increased by 23 rigs to 899 active rigs. While this count increased from the prior week, compared to a year ago, the rig count is down by over 1,000 rigs marking one of the worst downturns in the industry history. Our favorite chart shows the rig count for 2000-2009 compared to the rig count of 1973-1983. The similarities are stunning, but even more so if one plots the rig counts indexed to 100 at the start of the respective time periods.
The rig count increase was the first since a four-rig gain experienced during the first week of the second quarter of this year. It barely shows up on the rig count charts. All the rig-count gain last week was onshore as the Gulf of Mexico rig count actually fell by one. Interestingly, the number of directional and horizontal rigs working each increased by 10 over the prior week with the number of vertical rigs up by only three. That would suggest gas shale drilling is continuing at a healthy pace, which could produce a greater problem for the natural gas industry later this year. So does this mid June rig count signal a turning point for the oilfield service industry?
The domestic rig count peaked at the end of August 2008 at 2,031 and has fallen steadily with the exception of that one week rise in April until last week, or for 39 out of the last 41 weeks. With oil futures prices hovering around $70 a barrel and natural gas futures holding somewhere around $4 per thousand cubic feet, producers are feeling better about spending money to drill more wells. If oil prices continue to rise as suggested by OPEC and Russian leaders and Wall Street analysts, then producers will probably have greater cash flows than they anticipated at the start of 2009 when oil prices were virtually half the price they are trading at now. That will provide ammunition for increased drilling.
Analysts have become much more confident about a recovery in natural gas prices during the second half of the year as they believe the current reduction in the rig count will result in a fall of 1.5 billion cubic feet per day to as much as 4.0 billion cubic feet of gas production by the end of the year. This production fall would essentially eliminate the estimated current surplus over demand. A hike in gas demand with a recovery of housing and automobiles would further accelerate the closing of that gap, but there are few signs of any significant near-term recovery for these industries. Also not factored into the supply/demand equation is the prospect of rising liquefied natural gas (LNG) shipments arriving on U.S. shores that could expand supplies and put downward pressure on natural gas prices.
Trying to forecast a recovery for the energy and oilfield service industries is a challenge given the inability to project future global economic activity and credit market conditions with any degree of certainty. Across the globe, countries have responded to the economic recession and credit crisis with massive stimulus efforts. Some efforts are more targeted than others and are beginning to show signs of possible success while others are lagging well behind and run the risk of pumping up domestic economies after they are well into their recovery phase. The debate ongoing in the United States reflects citizen concerns about the massive spending associated with Pres. Obama's spending and stimulus programs along with his willingness to inject the federal government into American industries.
We found the following cartoon originally published in The Chicago Tribune in 1934 in response to the economic, political and social policies of President Franklin D. Roosevelt in his attempt to overcome the conditions of the Great Depression. Many critics of Pres. Obama's action plans subscribe to the view that he is working to usher in an economic, political and social system more similar to those found in many European countries. These economies, however, tend to have slower economic growth, higher unemployment, higher taxation and a lack of entrepreneurial enterprise than found here.

FDR's plan of action outlined in the cartoon states: Plan of Action For U.S. Spend! Spend! Spend! Under the guise of recovery -bust the government -blame the capitalists for the failure -junk the constitution and declare a dictatorship. To many this will sound like Pres. Obama's plan for America.
The impact of the economic and political debate is to hamstring American business with proposed regulatory changes that could radically alter how companies have operated for many years. Possible changes to corporate taxation, the introduction of "Buy America" policies, government introduction of corporate governance mandates and pay restrictions along with highly restrictive energy policies that mandate the use of fuels that are the most expensive rather than least costly will alter the business playing field. Until regulation begins to become clearer, which may take as long as another year, corporate leaders will be reluctant to rehire employees and step up capital spending. With this background, and without delving into the intricacies of the Obama administration policies, we assume U.S. economic growth will only slowly recover with positive gross national product growth in the fourth quarter and modest growth continuing through 2010.
To us that suggests a modest recovery in global oil prices but only modest price increases for natural gas prices. Strong oil prices and weaker gas prices mirrors structural factors in the global oil market versus the U.S. natural gas market. Drilling activity, which is about 70% dependant on natural gas, will slowly recover. We forecast a recovery from now into early 2010 at an average of five rigs per week. We then expect the pace of increase to double and reach about 1,500 rigs by the end of 2010. The challenge is that this is not the only scenario we can develop -some better and others much worse.
We have plotted the Baker Hughes domestic rig count since 1949 along with our forecast. On the chart we have circled several time periods -two in red, one in blue and one in green. As can be seen, the sharp fall in the rig count over the past 10 months compares to the fall in 1985 and 1986. The question we have is: Will the rig count rebound mirror the period of volatility experienced in 1982- 1985 and in the 1950s? There were various petroleum industry regulatory changes that occurred in the 1980s period that gave the business periodic jolts of optimism and thus stimulated drilling. These included lifting price restrictions on interstate natural gas and opening the Gulf of Mexico up to area-wide leasing. The subsequent collapse in world oil prices brought down the entire global petroleum industry. The volatility of the 1950s was driven by exploration successes that created pricing problems due to oil oversupply conditions and production restrictions in the United States.
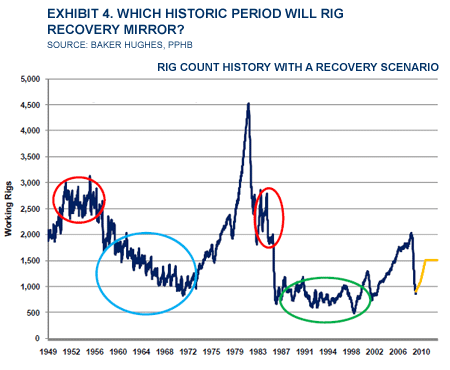
The big question on our mind is what will be the longer term future trajectory for the rig count. We anticipate there will be a near-term rebound as producers restore some capital spending after overly aggressive earlier budget cuts due to the uncertainty during last fall's global credit crisis. To try to answer this question we examined the modern history of domestic rig count for patterns caused by industry conditions that might prevail in the future.
The 1990s rig count pattern (in the green circle) reflected a time of low natural gas prices and relatively low crude oil prices. These low commodity prices existed despite accelerating economic growth. Prices were depressed largely because of new global oil supplies and existence of adequate surplus oil productive capacity that held prices in check.
The more sinister rig count pattern was that of the 1960s (in the blue circle) that reflected the time period when the U.S. had surplus oil production and was forced to restrict production (Texas Railroad Commission regulated the number of days of the month and volume of a well's production) to prevent prices from collapsing. Low oil prices coupled with very low (due to regulatory restrictions) natural gas prices made being in the oil and gas exploration and production business a high-risk occupation. This period was when many of the mid-sized domestic oil companies commenced international exploration efforts in an effort to earn greater profits. Midcontinent oil producers such as Marathon Oil, Continental Oil, Phillips Petroleum, Hess and Occidental Petroleum all began foreign exploration efforts, often teaming up in partnerships in places such as North Africa. The companies evolved into larger and more successful companies as a result of this global expansion driven by the economic squeeze on the domestic oil and gas business.
As we look to the future, we are torn by conflicting views about the pace of the economic recovery. If it begins to accelerate and we experience meaningful recoveries in the domestic auto and housing sectors, then energy demand will grow, commodity prices will solidify, if not rise further, and profitability will return to the E P business. On the other hand, a slow, protracted global recovery will keep pressure on commodity prices and further pressure E P company profits and the number of attractive exploration and development projects. This environment could result in producers continuing spending constraints, partly as a way to push oilfield service costs down. While the industry will remain profitable, profit growth likely will be anemic.
The biggest question mark in our possible scenarios is the issue of regulation. We have the issue of carbon regulation, which is well on its way to being implemented in the U.S. But will we have anti-oil regulations in the form of higher taxes, restrictions on the application of technology (rules limiting the use of hydraulic fracturing) and restrictions on access to promising exploration and development locations, to name just a few.
As we suggested above, our best guess is a slow, but steady increase in the rig count until it reaches a peak at about 1,500 rigs by the end of 2010. From that point forward we expect the rig count to go sideways, albeit with seasonal and price-volatility induced ups and downs. If natural gas prices, the principal driver of domestic drilling activity, languish due to growing gas shale production, increased LNG shipments and flagging demand, then we could be looking at a retreat from the 1,500-rig peak to something more like 1,200 to 1,300 rigs followed then by a sideways pattern. We also could envision a pattern that sees the domestic rig count slowly decline from the peak to a level closer to 900 as oil and gas industry profitability is steadily eroded.
At this point we are hesitant to put any probabilities on the various scenarios. We will be using these scenarios as our benchmark outlooks while monitoring the many economic and political variables we have outlined. The next several years will be a challenging period for the energy industry -- but we could have said that about almost any period in its history.
Managing Director, PPHB LP
- USA Regional Banks Dramatically Step Up Loans to Oil and Gas
- An Already Bad Situation in the Red Sea Just Got Worse
- Oil Markets Were Already Positioned for Iran Attack
- Valeura Makes Three Oil Discoveries Offshore Thailand
- EU Offers $900MM in Funding for Energy Infrastructure Projects
- Germany to Provide $2.3B Aid for Decarbonization of Industrial Sectors
- North America Breaks Rig Loss Streak
- Chile's ENAP Says Working on Decarbonization Plan
- Mexico Presidential Frontrunner Plans to Spend Billions on RE, Gas Power
- ExxonMobil French Unit to Sell Refinery to Entara-Trafigura Consortium
- Macquarie Strategists Warn of Large Oil Price Correction
- JPMorgan CEO Says LNG Projects Delayed Mainly for Political Reasons
- USA, Venezuela Secretly Meet in Mexico as Oil Sanctions Deadline Nears
- EIA Ups Brent Oil Price Forecast for 2024 and 2025
- Petrobras Discovers Oil in Potiguar Basin
- EIR Says Oil Demand Will Not Peak Before 2030
- Biden Plans Sweeping Effort to Block Arctic Oil Drilling
- Pantheon Upgrades Kodiak Estimates to 1.2 Billion Barrels
- Dryad Flags Red Sea 'Electronic Warfare' Alert
- USA Crude Oil Stocks Rise Almost 6MM Barrels WoW
- Oil and Gas Executives Predict WTI Oil Price
- New China Climate Chief Says Fossil Fuels Must Keep a Role
- Chinese Mega Company Makes Another Major Oilfield Discovery
- Oil and Gas Execs Reveal Where They See Henry Hub Price Heading
- Equinor Makes Discovery in North Sea
- ExxonMobil Racks Up Discoveries in Guyana Block Eyed by Chevron
- Macquarie Strategists Warn of Large Oil Price Correction
- DOI Announces Proposal for Second GOM Offshore Wind Auction
- Standard Chartered Reiterates $94 Brent Call
- Chevron, Hess Confident Embattled Merger Will Close Mid-2024