Musings: East Coast Blizzard And Snowy Europe = Climate Change?


The weekend before Christmas northern Europe was hit by a significant winter storm and extremely cold weather that disrupted holiday travel plans for millions as major airports were shut for days in some cases, and highways and train tracks were blocked. As Europe was recovering, the U.S. East Coast was blanketed by a winter blizzard dumping double-digit snowfalls on many localities on Christmas weekend. The Christmas Blizzard of 2010, as the storm is being referred to by some, shut down the major airports in the New York area and shut down Amtrak train service between New York City and Boston. Earlier, the storm had hit Atlanta, Georgia and the southern tier states. While Washington, D.C. escaped the snow, further north New Jersey was slammed as well as states further up the coast.
Possibly the bigger discussion underway is how we can be in the grip of such cold and wintry weather yet have the National Oceanic and Atmospheric Administration claiming 2010 may be the warmest year on record
As this article is being written, Florida is in the grips of a deep freeze that has commodity markets all in a tizzy over the potential impact of the cold weather on that state's citrus crop and indirectly on food inflation in this country. Possibly the bigger discussion underway is how we can be in the grip of such cold and wintry weather yet have the National Oceanic and Atmospheric Administration (NOAA) claiming 2010 may be the warmest year on record. The explanation may lie in an item that was part of an article in the Financial Times discussing the European winter storm. The article pointed out that the extremely early winter cold striking Northern Europe could be due to a climate phenomenon called the North Atlantic Oscillation (NAO). The NAO is a measure of the difference in sea-level pressure between the Icelandic Low and the Azores High.
A negative NAO in winter creates a blocking force over the northern latitudes, which prevents the normally mild westerly winds reaching Europe from the relatively warm ocean waters
The NAO is in what is called its negative phase. That is when atmospheric pressure is unusually high over the Arctic yet low further south. A negative NAO in winter creates a blocking force over the northern latitudes, which prevents the normally mild westerly winds reaching Europe from the relatively warm ocean waters. Instead, cold air blows from the Arctic region. NOAA has determined that the strongly negative NAO experienced last winter has returned. The NAO index during November 2010 was the second lowest since 1950. This strongly negative index seems to have continued through December. Through the first two-thirds of December, average temperatures in the UK have been the lowest for 100 years.
The question is whether the strong NAO currently in place (it has been in this negative phase for 15 months now, the longest period on record) is just a random climatic event or is linked somehow with climate change. That concern is predicated on the supposition that global warming may have changed the atmospheric circulation that increases the risk of cold winters in Northern Europe. If this is true, then the statement by a Gatwick Airport spokesperson about their rethinking the need to invest in more snow removal and de-icing equipment could prove prescient. "This is not a one-in-20-years event. It's going to be more frequent than that as the past few weeks have shown."
The blizzard of 2010 that socked the New York area left the region reeling as there were problems with snow removal in New York City and reopening the airports and moving the passengers stranded by the thousands of flights canceled. According to weather reports, the storm dumped 20.0" of snow on New York City's Central Park, making it the sixth largest snowstorm for the city in recorded history and the second top-ten snowstorm this year. According to the records, New York City has had four of its top-ten snowfalls in the past decade - #7, 19.8" Feb. 16-17, 2003; #6, 20.0" Dec. 26-27, 2010; #4, 20.8" Feb. 25-26, 2010; and #1, 26.9" Feb. 11-12, 2006.
Newark, New Jersey's 24.2" snowfall was one that city's top-ten snowstorms of all-time and the 20.1" that fell on Atlantic City, NJ was that city's second largest snowfall in history. Atlantic City's three biggest snowstorms have all occurred in the past ten years. Philadelphia, Pennsylvania picked up 12.4", the city's fourth one-foot or greater snowstorm in just over a year. That is an amazing string given that the city has had just 24 such snowfalls since 1884. The latest snowfall brought Philadelphia's 2010 snowfall for the calendar year to 67.3", breaking the mark for snowiest year ever. The previous record was 57.0" in 1978.
New York City has had four of its top-ten snowfalls in the past decade
So is there a pattern developing? And does that pattern have anything to do with global warming? Several climatologists researched snow storms in a 2006 report. The map below (Exhibit 19) shows the annual average number of snowstorms with a 6-inch or greater accumulation from the years 1901-2001. A value of 0.1 means an average of one 6-inch plus snowstorm every ten years. While there are a large number of these 6-plus inch snowstorms in the mountains of the West, there also has been a marked rise in their number in the Northeast during the past ten years. This raises the question of whether the rise is due to random chance or a change in the climate.
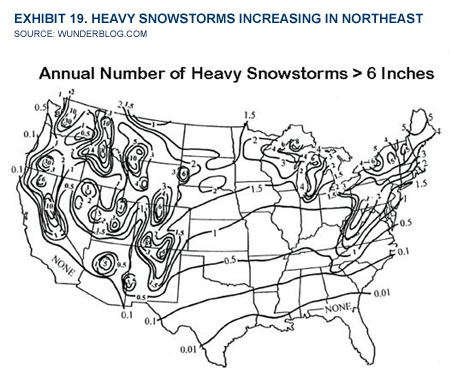
According to Dr. Jeff Master's WunderBlog, a study done of the top ten heaviest snowstorms on record for each of 121 major U.S. cities showed no upward or downward trend in these very heaviest snowstorms during the period 1948-2001. Dr. Masters wondered whether if this study were updated to include the last decade's data whether the conclusion would change. He went on to say that bigger snowstorms are not an indication that global warming is not occurring. He reminded his readers that there is an old adage, "It's too cold to snow," which has some truth to it. There is research showing that the average climate in the U.S. is colder than optimal to support the heaviest snowstorms. A 2006 study found that for the contiguous U.S. between 1900-2001, some 61%-80% of all heavy snowstorms of 6-plus inches occurred during winters with above normal temperatures. The authors of the study also found that 61%-85% of all heavy snowstorms of 6-plus inches occurred during winters that were wetter than average.
The authors conclude, "a future with wetter and warmer winters, which is one outcome expected (National Assessment Synthesis Team 2001), will bring more heavy snowstorms of 6-plus inches than in 1901-2000." The authors also found that over the U.S. as a whole, there had been a slight but significant increase in heavy snowstorms of 6-plus inches than in 1901-2000. Based on this study, one could conclude that if the climate continues to warm, we should expect an increase in the number and intensity of snowstorms over the next few decades, or until the climate grows so warm that we pass the point where winter temperatures are at the optimum for heavy snow events.
Based on this study, one could conclude that if the climate continues to warm, we should expect an increase in the number and intensity of snowstorms over the next few decades
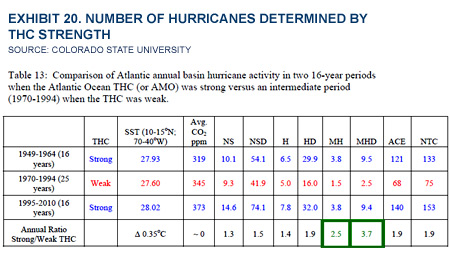
What is interesting about the NAO is that it is also the climate phenomenon responsible for Atlantic basin hurricane activity. As we wrote in our last Musings when discussing the early tropical storm forecast for 2011 made by Colorado State University (CSU), the question is always asked whether the high number of tropical storms is due to global warming and especially its impact on sea surface temperatures. Dr. William Gray has devoted most of his research time over the past few years to assessing the role of global warming and increased tropical storm activity. So far he has found no causal relationship. The CSU forecast team believes that the primary driver for tropical storm formation is the Thermohaline Circulation (THC) that is a large scale Atlantic Ocean circulation pattern driven by changes in salinity and temperature. The THC is often related to the Atlantic Multi-Decadal Oscillation (AMO). When the THC is stronger than normal usually the AMO is in its warm or positive phase. Likewise when the THC is weaker than normal the AMO is in its cool or negative phase. The AMO is also known as the ANO.
What Dr. Gray has found is that CO2 levels are not correlated with the THC or sea-surface temperatures. As a result, the strength of the THC (or AMO) is the principal driver for tropical storm activity and major hurricane activity in particular. The relationship between the strength of the THC and storm activity is very consistent over 1949-2010. In its simplest form, the THC/AMO is the driving force for storm activity and it is a variable trend that potentially has long-term cycles. These natural variations may also explain other climate phenomenon such as winter snows.
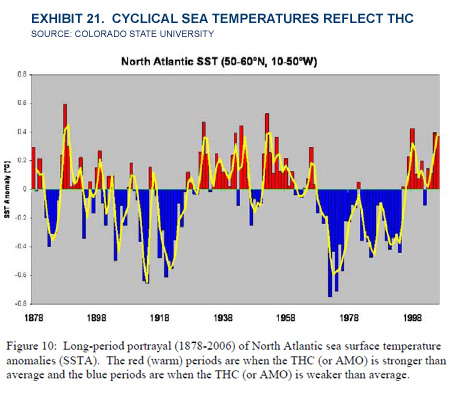
What we know about climate patterns such as THC and AMO is that they are cyclical and their live span can vary considerably. The chart of changes in sea surface temperatures over 1878-2006 demonstrates these points quite well. (Exhibit 21.)
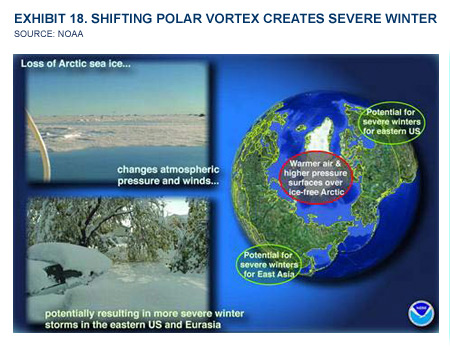
A paper titled "Hot Arctic-Cold Continents: Hemispheric Impacts of Arctic Change" presented by Dr. Jim Overland of NOAA's Pacific Marine Environmental Laboratory at the annual meeting of the American Geophysical Union in December focused on the recent reversal of the Polar Vortex and how high pressure replaced low pressure over the Arctic. Normally the Arctic is dominated by low pressure in winter and a Polar Vortex of counter-clockwise circulating winds develops surrounding the North Pole. During the winter of 2009-2010, high pressure replaced low pressure over the Arctic, and the Polar Vortex weakened and even reversed at times, with a clockwise flow of air replacing the usual counter-clockwise flow. This unusual flow pattern allowed cold air to spill southwards into the Eastern U.S. and Northern Europe and be replaced by warm air moving poleward. This altered pattern brought record snowstorms to Europe and the East Coast along with the coldest temperatures in 25 years, while also delivering the warmest winter on record to Canada and much of the Arctic. This Polar Vortex reversal has happened only four times in the past 160 years – 1969, 1963, 1936 and 1881. What we noticed is that 1963 was within the first strong THC period and 1969, while not within the strong THC period was in the interim period before the start of the THC weak period. (Exhibit 20.) Could there be a relationship or explanation?
It is impossible to know whether or not the Northeast United States and Northern Europe are in for years of heavy snowstorms and cold weather. We suppose that these causal relations between global warming and heavy snowstorms will continue to be made in the media and supported by climatic research. What is becoming clearer every day is that developing simple explanations of the Earth's climate is much more difficult than global warming proponents anticipated. On the other hand, their claims need to be examined to see whether there are elements of relationships that need to be understood so the world can have a better climate in the future.
Managing Director, PPHB LP
- What's Next for Oil? Analysts Weigh In After Iran's Attack
- Venezuela Authorities Arrest Two Senior Energy Officials
- CNOOC Bags Contract for 4.6 MMcf of LNG for Philippines
- EU Gas Storage Nearly 60 Percent Full at End of Heating Season
- EIA Raises WTI Oil Price Forecasts
- ExxonMobil Makes FID on 6th Project in Contested Guyana Asset
- Is The Iran Nuclear Deal Revival Project Dead?
- ORE Catapult Looks for New CEO as Jamieson Steps Down
- Japan's Mizuho Invests $3.64MM in Bison's CCS Project in Alberta
- Equinor Advances First Battery Storage Projects in USA
- Macquarie Strategists Warn of Large Oil Price Correction
- JPMorgan CEO Says LNG Projects Delayed Mainly for Political Reasons
- USA, Venezuela Secretly Meet in Mexico as Oil Sanctions Deadline Nears
- EIA Ups Brent Oil Price Forecast for 2024 and 2025
- Petrobras Discovers Oil in Potiguar Basin
- EIR Says Oil Demand Will Not Peak Before 2030
- Biden Plans Sweeping Effort to Block Arctic Oil Drilling
- Pantheon Upgrades Kodiak Estimates to 1.2 Billion Barrels
- Dryad Flags Red Sea 'Electronic Warfare' Alert
- Russian Oil Is Once Again Trading Far Above the G-7 Price Cap Everywhere
- Oil and Gas Executives Predict WTI Oil Price
- New China Climate Chief Says Fossil Fuels Must Keep a Role
- Chinese Mega Company Makes Another Major Oilfield Discovery
- Oil and Gas Execs Reveal Where They See Henry Hub Price Heading
- Equinor Makes Discovery in North Sea
- ExxonMobil Racks Up Discoveries in Guyana Block Eyed by Chevron
- Macquarie Strategists Warn of Large Oil Price Correction
- DOI Announces Proposal for Second GOM Offshore Wind Auction
- Standard Chartered Reiterates $94 Brent Call
- Chevron, Hess Confident Embattled Merger Will Close Mid-2024